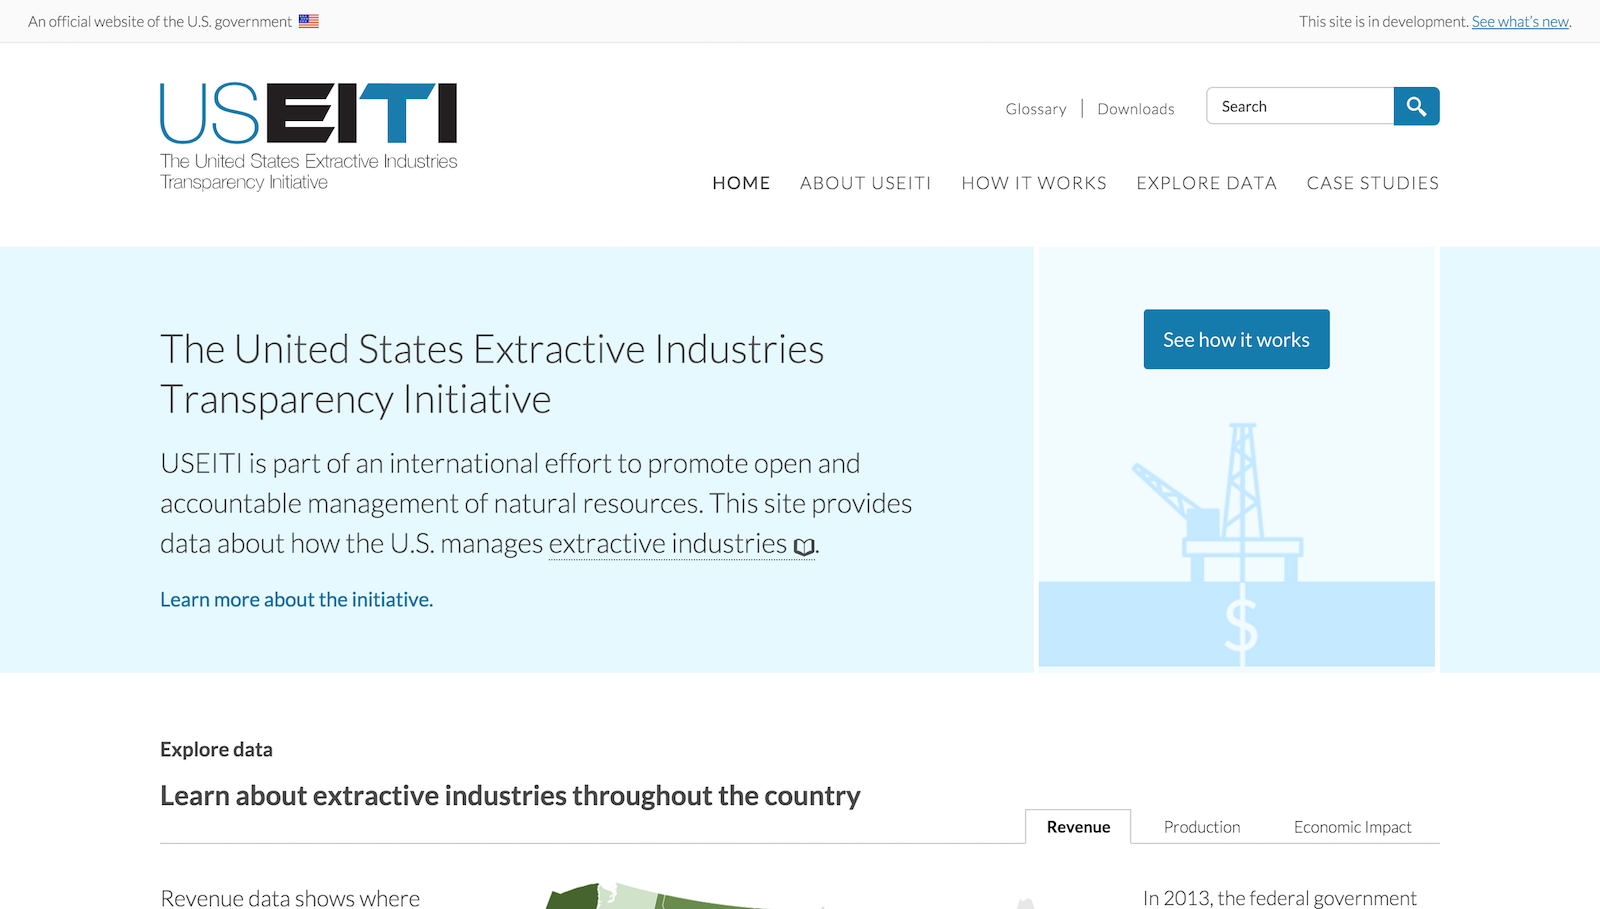
Just a few months ago, we wrote about the next phase of the United States Extractives Industry Transparency Initiative (USEITI), one of our oldest projects with the lofty goal of educating and informing public debate around natural resources produced on public land. This week, the U.S. Department of the Interior released the first report from the United States, a major step toward becoming fully compliant with the global EITI standard. You should really stop reading this post and check it out for yourself.

This project is the culmination of hard work and years of effort across many parts of the U.S. government and collaboration among the 39 members of the USEITI multi-stakeholder group. Here at 18F, we were behind the scenes building and designing the online report — but major congratulations are due to all the parties involved in releasing this report.
What’s in the report
We’ve mentioned our work on this project a few times in the last couple months. We recapped what we learned from usability research on the first iteration of the website and covered an interesting design challenge presented by the wholly new federal production data. As part of this week’s launch, this data is now online in the form of maps and tables that you can filter and sort to get a sense of how these industries affect your state, county, or offshore area.
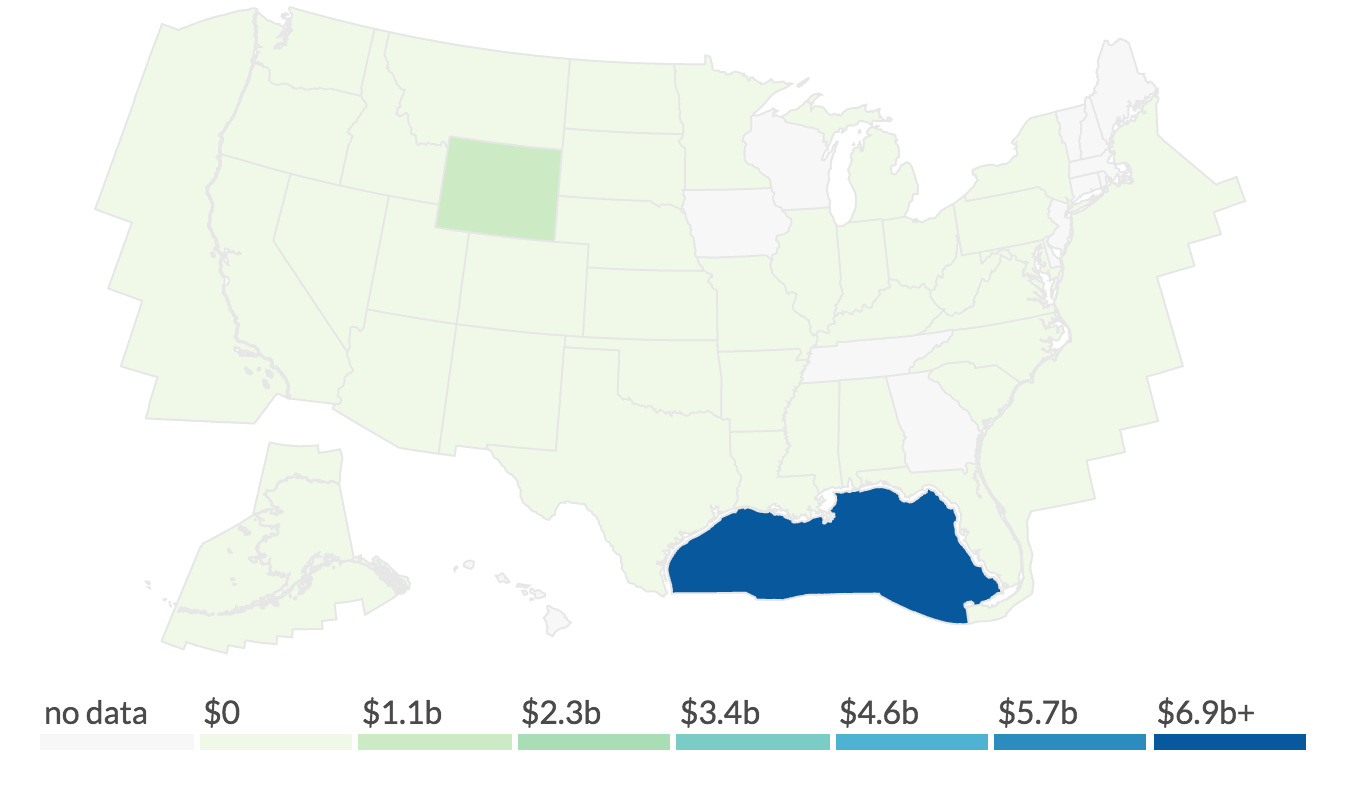
Visualizing data this diverse is not a simple task. Most of our datasets could be represented on a map, but some sets are more granular than others. You can see federal revenues across the country, or zoom in on a state or offshore area for a more detailed view of where money came from. From there you can filter by commodity or year. You can learn a lot by exploring the data. In some places you can watch industries grow, like oil and gas in North Dakota. You can spot major production centers like Campbell County, WY, which produced almost 35 percent of all coal in the U.S. in 2013. Nearly 88 percent of that coal was produced on federal lands, accounting for 80 percent of federal revenue from coal.
A map from the 2015 USEITI report showing federal revenue data for all locations in 2013. Explore other years and specific commodities on the site.
Other datasets in the report were not mappable: Federal revenue is also broken down by company, for example, and is shown with filterable bar charts. In order to show where those revenues go within the federal government, we used a bubble graph to show the relative size of each disbursement with a table explaining the breakdown in more detail.
Another component of the USEITI initiative we haven’t covered before is how it all works. The 2015 report contains a detailed account of how companies secure rights to use federal land for natural resource extraction. It generally follows five steps: plan, lease, explore, develop, and decommission. For each type of industry, there’s a detailed account of how government, industry, and other parties work together through these five steps. For oil and gas, those steps are slightly different depending on whether the work is happening onshore or offshore. Check out the “how it works” page for more information about other industries.
In addition to explaining the different steps in the process in plain language, our team built a glossary that lets users look up terms like “lease condensate” and “wet gas” to learn what they mean in this context. This lets anybody, regardless of how well they already understand the industry, leave the site more informed than when they entered.
We recognise that a public understanding of government revenues and expenditure over time could help public debate and inform choice of appropriate and realistic options for sustainable development. – The EITI Principles
Informing public debate is a key goal of the global Extractives Industry Transparency Initiative. The bulk of 18F’s work in helping U.S. Interior publish the first USEITI report was about making the data easier to navigate, explore, and understand. Doing that makes information about these crucial resources and the industry around them more accessible to the public. Have a look around the site and let us know what you learn from it.


